- OnTheDocket
- Posts
- Formula's you might not have known about
Formula's you might not have known about
David Frost
October 06, 2023

⚾PRE GAME WARMUP
Happy Friday!
The overnight crew ate some time off the clock in a sideways formation while they’re "waiting on the phony jobs number..."
Here's how things shape up today...
Above yesterday's close the door is open for the elusive [member login] area. Getting above or opening the day above clears the way for the next leg higher taking price up to 427.50 or more...
Any more bullish activity will be handled in a real time type formation...
The flip side is getting below [member login] which opens the door for lower prices such as [member login] and more...
The "and more" part will be posted as and if needed..
Next week is where earning season really gets underway. Volatility is elevated now, can’t wait to see what happens when companies beat their lowered expectations (or miss them…)
🎬THINK IN PICTURES
We use the charts to tell a story. We look for hints and clues putting us on the right track.
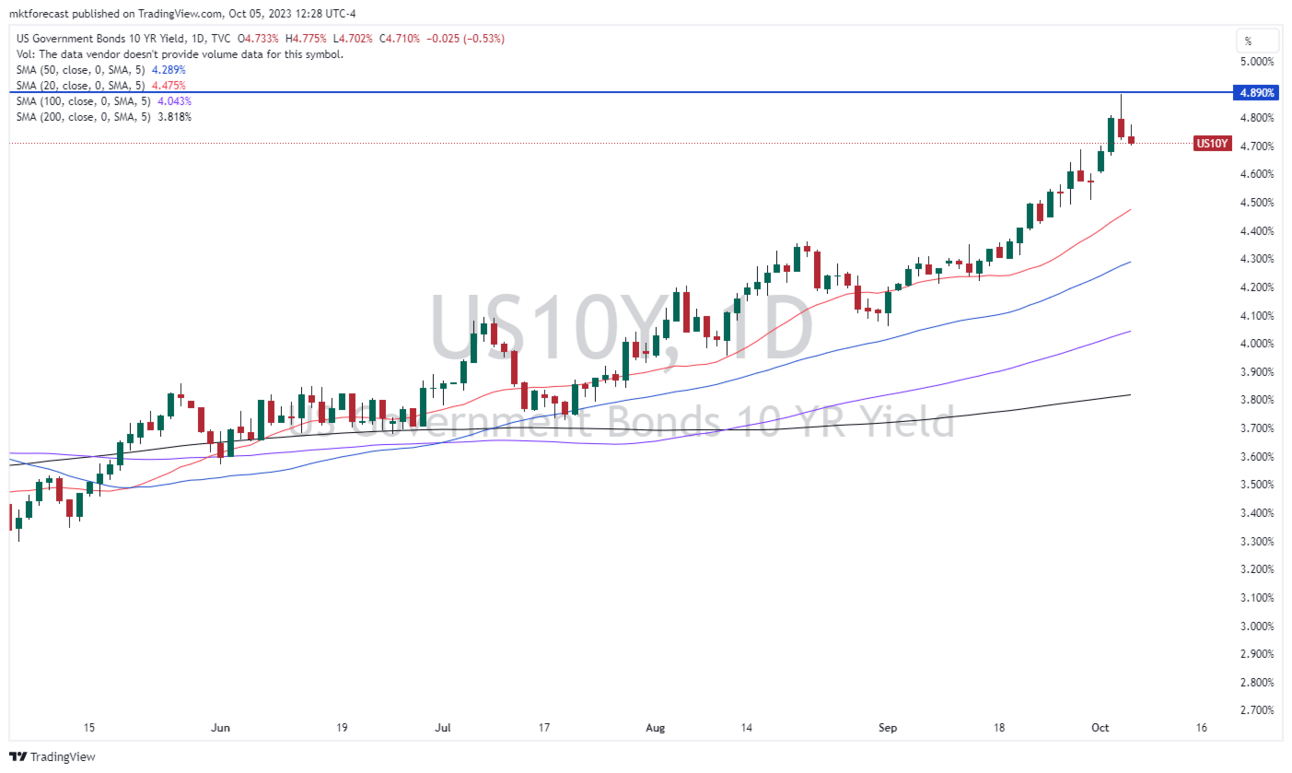
Think back to the 10 year yield chart from the other day and how it was basically at resistance. Was there a clue found away from rates that might have given just a touch more confidence we were on the right track?
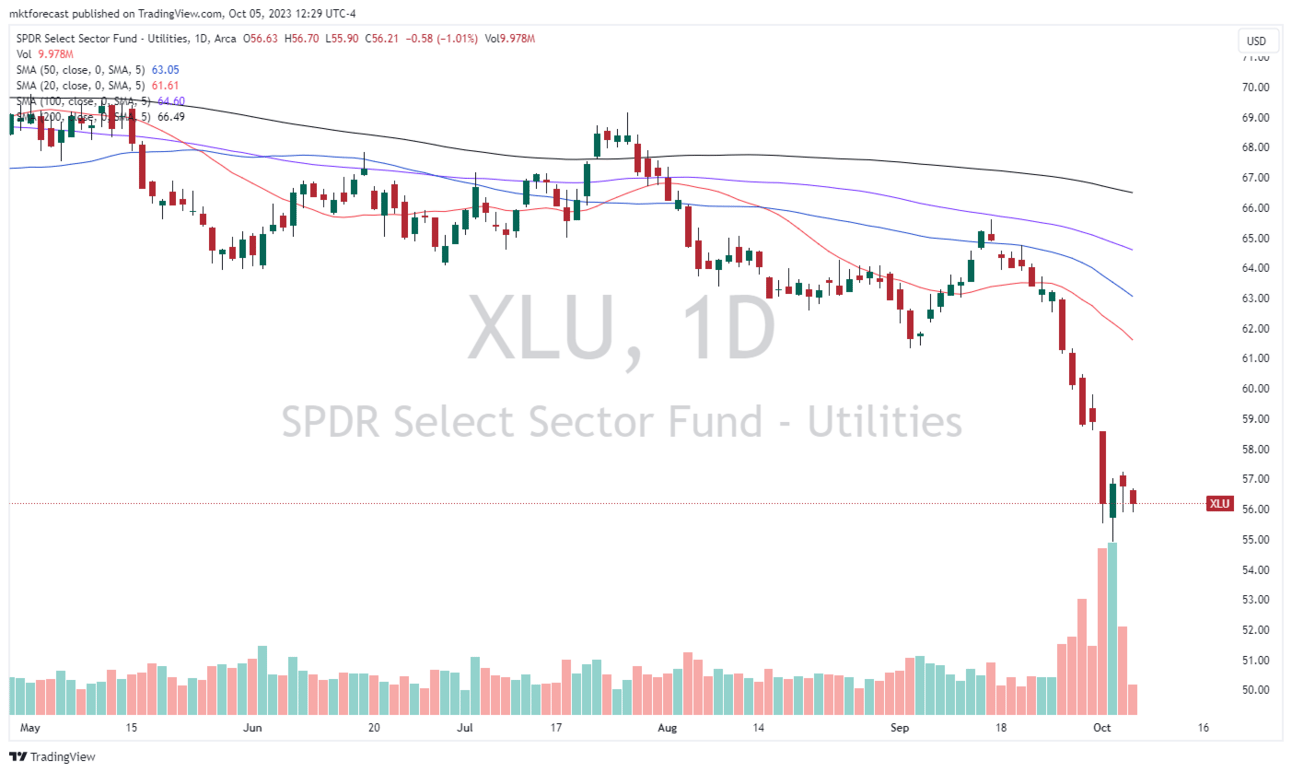
Enter the XLU or the spider utilities exchange trades fund. It’s basically a basket of debt ridden, slow growing utility companies. They’re VERY interest rate sensitive since the cost of borrowing was rising at a fast pace. They borrow a lot for plant and equipment to keep the lights on.
The first chart shows the XLU which put in a low on Tuesday October 3rd.
The next chart is the 10-year treasury yield again, showing a high on October 4th.
How did the utility people know to buy em’ the day before? Funny how that works…
🌗RECYCLE TIN FOIL HAT
Many times markets trade up or down into one of these tin foil events. The month of October includes an event worth knowing about.
We’ve got an annular solar eclipse next week on October 14th.
Visit: nasa.gov to learn something about it.
Share OnTheDocket
You currently have 0 referrals, only 5 away from receiving Free Month InsideTheNumbers LIVE.
💣WRECKONOMICS
Today is the phony jobs number. It’s an exercise in the ridiculous. Market participants watch the dater release at eight thirty in the morning, about an hour before the opening bell. The numbers are released, markets whip around, the talking heads pontificate on what it all means…
Is the Fed going to pause? Will they continue to raise rates? Are they going to stay higher for longer? Will we have a recession? How about the soft landing thing? Might as well throw in some green shoots to boot…
The reality is another government agency releasing numbers using a formula Einstein couldn’t figure out. The numbers have a margin of error you can drive a truck through.
Here’s one of their formula’s (thought it was a joke?)
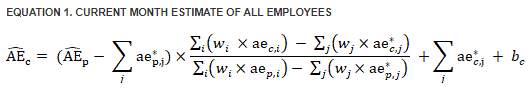
Source: BLS How we calculate and use statistics
Some would wonder why they just don’t take the receipts from the IRS and use that data as a pretty good source of what’s going on…
Not to mention the numbers released today will be revised around 4 times over the next several weeks as they realize the math was wrong. Also included in todays report are the revisions from the previous several reports.
Why would traders, investors and pundits be laser focused on a number that has a margin of error like 175 jobs, then revised later because they know today’s number is an estimate that has no chance of begin correct?
Here’s where it gets cute. Let’s say they release the number and the market sells off. The TV people start having a discussion about recession, the Fed and how bad things are.
But wait, there’s more…
All of a sudden the market turns around, begins climbing back up and mysteriously the conversation changes to positive as they forget about what happened 10 minutes ago…
The moral of the story is the market movement drives the economic conversation, not the other way around as the pundits would have you believe.
It’s the old tail waging the dog scenario, and they have no idea they’re the dog and the market is the tail…
🩺PSYCH WARD
What is your size? We’re talking position size that is…
How many shares or contracts to buy or sell short? The question always comes up, how much should I allocate to each trade?
First we must realize the only person who can answer that is you, however we can develop a road map to help figure it out.
Think engineer, not the kind that fixes stuff and knows how everything works, but the kind that helps us back into the numbers.
We’re going to reverse engineer the thing. Everybody has an uncle point, so we’ll start there. On a day trade, we must decide how much our maximum loss is before agreeing to enter a position. Let’s use $1000 as the number today. If I’m buying a stock at $50 per share and the stop (for this example) is getting below $48 per share.
A two dollar draw down with 500 shares puts us at max loss limit.
How about leaving some room to buy more in between 50 and a little lower? If you go all in with 500 shares on the initial purchase, you’re out of personal buying power because the purchase price minus the stop multiplied by # of shares pins you to the wall…
How about leaving some room in case the stock doesn’t bounce at the number, sometimes they spike em’ through…
We all know our mind plays tricks, and regardless of how we thought we’d feel if the stock went down near the stop with a full position, once it’s headed down, we’re uptight, nervous, anxious and scared to lose the money. Once we get in an uncomfortable position (whether in life, the market or both), we’re looking for reasons to get out of it. Uncomfortable feelings create bad decisions.
We work on the premise of “base hits put you in the hall of fame.” Starting with 250 shares in this case would be more prudent, leaving room for another purchase. If the stock bounces and gives you the trade with only 250 shares, so what, it’s a win and you’re on to the next trade…
You don’t have to hit a home run on every day, in fact you won’t. You never know which ones will give you the rocket ride…
🏆MEMBERS SAYIN’
“In September I was 26 for 29 on Dave's day trades. I was 0 for 2 on trades I identified in the afternoon. I gave back 14% of monthly earnings on those 2 trades.” Shannon B.
COMMON SENSE MARKET STUFF EVERY DAY
DISCLAIMER STUFF: Nothing found in this communication is financial advice. This newsletter is strictly educational and not intended for or should be thought of as investment advice or a solicitation to buy or sell any assets or to make any financial decisions whatsoever. Please be careful and always do your own homework.